

(Millions of yen)
| March 2021 | March 2022 | March 2023 | March 2024 | March 2025 | |
|---|---|---|---|---|---|
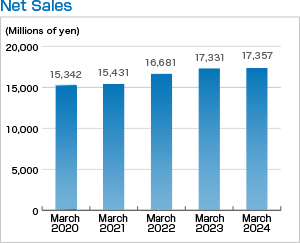
| Net Sales | 15,431 | 16,681 | 17,331 | 17,357 | 18,066 |
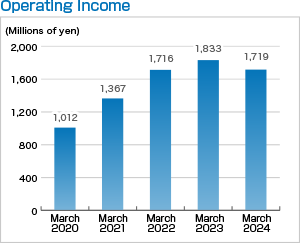
| Operating Income | 1,367 | 1,716 | 1,833 | 1,719 | 1,807 |
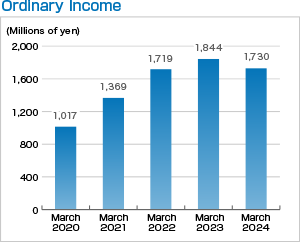
| Ordinary Income | 1,369 | 1,719 | 1,844 | 1,730 | 1,821 |
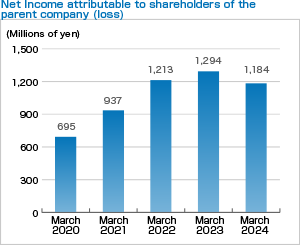
| Net Income attributable to shareholders of the parent company (loss) | 937 | 1,213 | 1,294 | 1,184 | 1,293 |
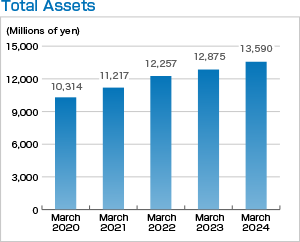
| Total Assets | 11,217 | 12,257 | 12,875 | 13,590 | 14,430 |
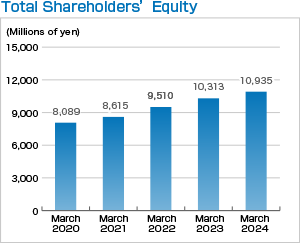
| Total Shareholders' Equity | 8,615 | 9,510 | 10,313 | 10,935 | 11,782 |
| Operating Income to Net Sales (%) | 8.9 | 10.3 | 10.6 | 9.9 | 10.0 |
| Ordinary Income to Net Sales (%) | 8.9 | 10.3 | 10.6 | 10.0 | 10.1 |
| Net Income to Net Sales (%) | 6.1 | 7.3 | 7.5 | 6.8 | 7.2 |
| Ordinary Income to Total Assets (%) | 12.7 | 14.6 | 14.7 | 13.1 | 13.0 |
| Return on Equity (%) | 11.2 | 13.4 | 13.1 | 11.1 | 11.4 |
| Equity Ratio (%) | 76.8 | 77.6 | 80.1 | 80.5 | 81.6 |
| Current Ratio (%) | 381.4 | 422.2 | 494.9 | 530.3 | 523.6 |
| Fixed Assets Ratio (%) | 28.2 | 20.7 | 18.3 | 11.2 | 15.7 |
| Number of Employees | 869 | 890 | 891 | 930 | 944 |
| Net Sales per Employee (thousands of yen) | 17,758 | 18,742 | 19,451 | 18,663 | 19,138 |
| Operating Income per Employee (thousands of yen) | 1,573 | 1,928 | 2,057 | 1,849 | 1,914 |
| Ordinary Income per Employee (thousands of yen) | 1,576 | 1,932 | 2,069 | 1,861 | 1,929 |
Note1: The amount of money rounds off a fraction less than a unit to a 1 million yen unit.
Note2: Per employee data are based on the number of employees at fiscal year-ends.
| March 2021 | March 2022 | March 2023 | March 2024 | March 2025 | |
|---|---|---|---|---|---|
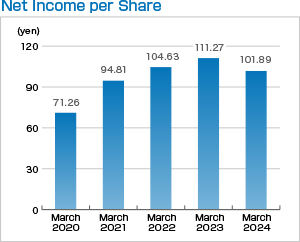
| Net Income per Share (yen) | 94.81 | 104.63 | 111.27 | 101.89 | 111.59 |
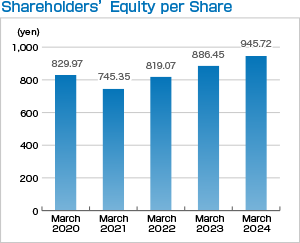
| Shareholders' Equity per Share (yen) | 745.35 | 819.07 | 886.45 | 945.72 | 1,016.35 |
Note: As of October 1, 2020, a stock split was implemented at a ratio of 2 shares per common share.
Net income per share and Shareholders'Equity per Share are calculated on the assumption that the stock split was conducted at the beginning of the fiscal year ending March 2020.